
Unlocking the Potential of the Gartley Pattern in Forex Trading
The Gartley pattern, a powerful harmonic chart pattern, is a valuable tool for traders looking to identify potential Market reversals. Whether you're an experienced trader or just getting started, understanding and utilizing this pattern could significantly enhance your trading skills. In this article, we will delve into the intricacies of the Gartley pattern, including how to recognize it on forex charts and effective Strategies for trading it.
What is the Gartley Pattern?
The Gartley pattern is a harmonic chart pattern characterized by four Price swings (X-A, A-B, B-C, and C-D) and four Fibonacci retracement levels (0.618, 0.786, 1.27, and 1.618). This pattern forms a distinctive M or W shape on the chart, and traders consider it complete when the price reaches point D, known as the potential reversal zone (PRZ). At this stage, traders may enter a trade in the opposite direction of the previous trend.
How to Identify the Gartley Chart Pattern
Identifying the Gartley pattern on forex charts involves looking for the four price swings (X-A, A-B, B-C, and C-D) and corresponding Fibonacci retracement levels. The pattern can be bullish or bearish, depending on the direction of the initial X-A swing.
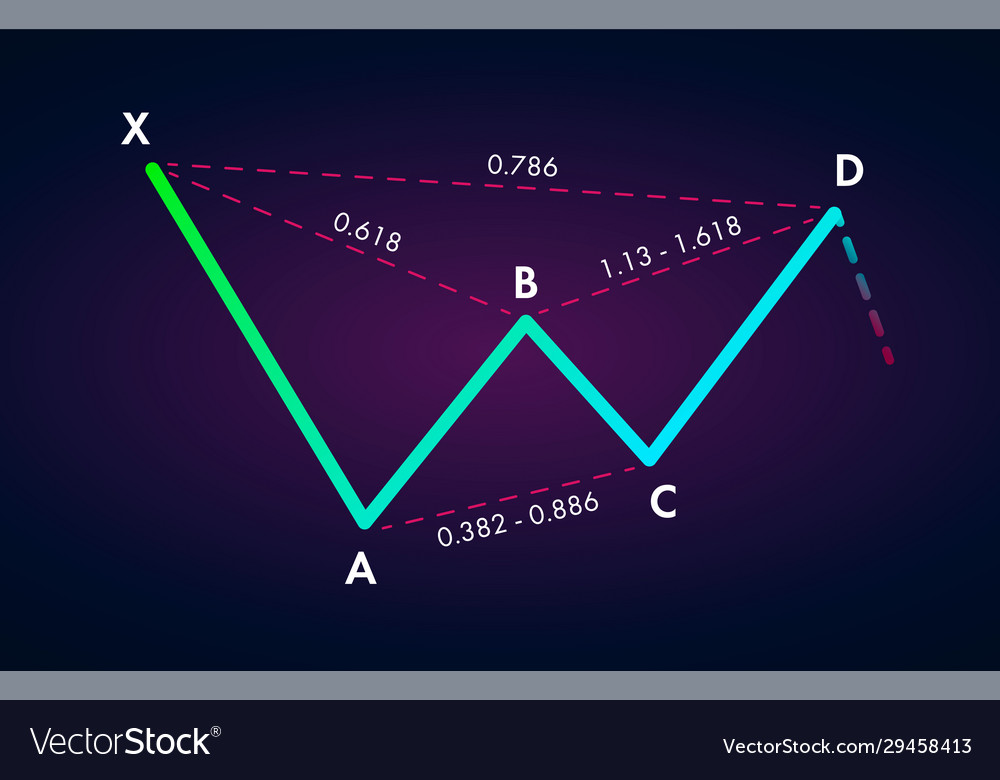
Bullish Gartley Pattern
- X-A: Initial uptrend defining the pattern direction.
- A-B: Retracement of X-A reaching the 0.618 Fibonacci level.
- B-C: Continuation of the uptrend reaching the 0.786 Fibonacci level.
- C-D: Final reversal of the uptrend reaching the 1.27 Fibonacci extension or the 0.786 Fibonacci retracement. This is where traders may enter a long position anticipating a new uptrend.
Here is an example of a bullish Gartley pattern on a forex chart:
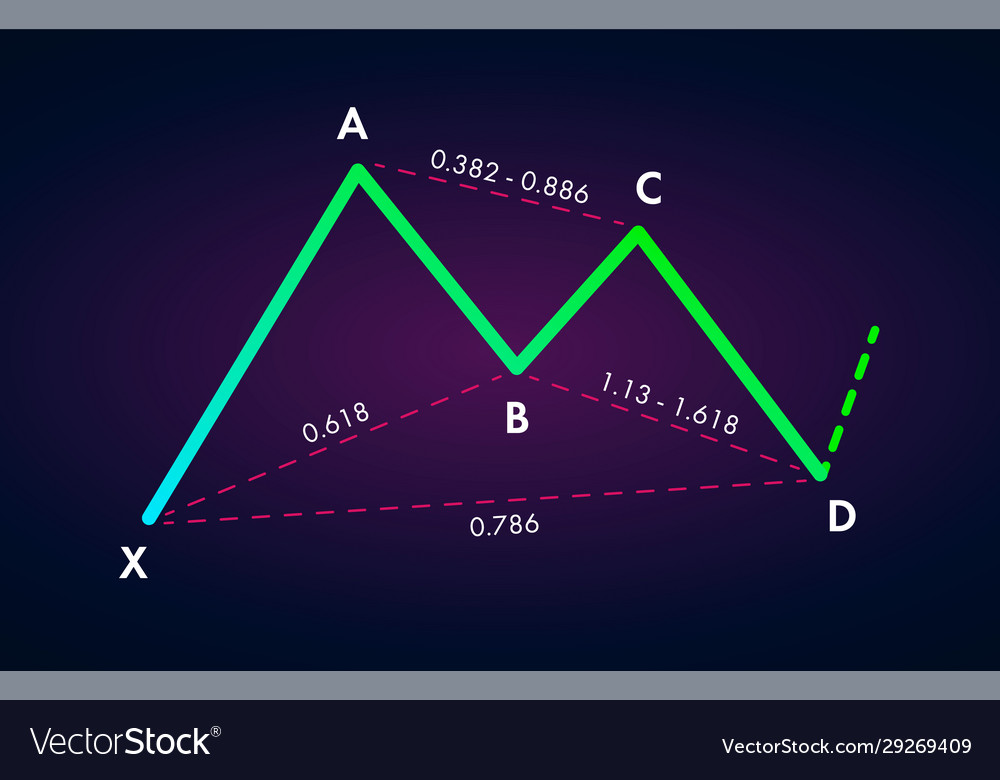Bearish Gartley Pattern
- X-A: Initial downtrend defining the pattern direction.
- A-B: Retracement of X-A reaching the 0.618 Fibonacci level.
- B-C: Continuation of the downtrend reaching the 0.786 Fibonacci level.
- C-D: Final reversal of the downtrend reaching the 1.27 Fibonacci extension or the 0.786 Fibonacci retracement. This is where traders may enter a short position in anticipation of a new downtrend.
Here is an example of a bearish Gartley pattern on a forex chart:
How to Trade Forex With the Gartley Chart Pattern
To trade forex using the Gartley pattern, follow these steps:
- Step 1: Identify the Gartley pattern on a forex chart.
- Step 2: Wait for the price to reach point D.
- Step 3: Enter a long or short position at point D.
- Step 4: Set your stop-loss order.
- Step 5: Set your take-profit order.
- Step 6: Monitor and adjust your trade as needed.
Example of Trading the Gartley Pattern in the Forex Market
- Consider a GBP/USD 1-hour chart showing a bullish Gartley pattern.
- Follow the Fibonacci retracement levels and enter a position at point D.
- Set stop-loss and take-profit orders accordingly.
- Exit the trade at the target price to secure profits.
Gartley Patterns vs. Harmonic Patterns
The Gartley pattern is a specific type of harmonic pattern used in forex trading. Harmonic patterns, including internal and external patterns, utilize Fibonacci ratios and geometric shapes to identify potential market reversals. Internal patterns like the Gartley consist of single impulse and corrective legs, while external patterns involve two impulse and corrective legs.
Tune Your Forex Trading Strategy with Gartley Harmonic Pattern
Integrating the Gartley pattern into your trading strategy can enhance your ability to identify trend reversals and make profitable trades in the forex market. Learn to recognize the pattern and implement effective trading strategies to optimize your trading Experience.
Frequently Asked Questions
Q: Is the Gartley pattern a reliable harmonic pattern?
A: The Gartley pattern can be a reliable harmonic pattern with a high success rate when traded correctly.
Q: Can Gartley harmonic patterns be used with Hakka nashi charts?
A: Yes, Gartley harmonic patterns can be used with Hakka nashi charts to filter out market noise and enhance trend visibility.
Q: Who invented the Gartley pattern?
A: The Gartley pattern was created by H.M. Gartley, a prominent technical analyst and trader who described it in his book "Profits in the Stock Market" in 1935.


